Tutorial: Reduced Order Model with Graph Neural Networks

⚠️ Before starting:
We assume you are already familiar with the concepts covered in the Data Structure for SciML tutorial. If not, we strongly recommend reviewing them before exploring this advanced topic.
In this tutorial, we use PINA to construct a graph-based reduced-order model for a parametrized partial differential equation. The workflow is largely inspired by A graph convolutional autoencoder approach to model order reduction for parametrized PDEs.
We will proceed in four stages:
- load finite-element solution snapshots;
- represent each unstructured mesh as a graph;
- train a graph autoencoder to compress and reconstruct the solution fields;
- train a parameter-to-latent network and use it to predict solutions for new parameter values.
Let us begin by importing the required modules.
## routine needed to run the notebook on Google Colab
try:
import google.colab
IN_COLAB = True
except:
IN_COLAB = False
if IN_COLAB:
!pip install "pina-mathlab[tutorial]"
!wget "https://github.com/mathLab/PINA/raw/refs/heads/master/tutorials/tutorial22/holed_poisson.pt" -O "holed_poisson.pt"
import torch
from torch_geometric.nn import GMMConv
from torch_geometric.data import Data, Batch
from torch_geometric.utils import to_dense_batch
import matplotlib.pyplot as plt
import warnings
warnings.filterwarnings("ignore")
from pina import Trainer
from pina.model import FeedForward
from pina.optim import TorchOptimizer
from pina.problem.zoo import SupervisedProblem
from pina.solver import SupervisedSingleModelSolver
Problem Setup and Data Loading
In this tutorial, we consider the following parametrized Poisson problem:
$$ \begin{cases} -\frac{1}{10}\Delta u = 1, &\Omega(\boldsymbol{\mu}),\\ u = 0, &\partial \Omega(\boldsymbol{\mu}). \end{cases} $$
Here, $\Omega(\boldsymbol{\mu}) = [0, 1]\times[0,1] \setminus [\mu_1, \mu_2]\times[\mu_1+0.3, \mu_2+0.3]$ represents the spatial domain characterized by a parametrized hole defined via $\boldsymbol{\mu} = (\mu_1, \mu_2) \in \mathbb{P} = [0.1, 0.6]\times[0.1, 0.6]$. The two parameters specify the lower-left corner of a square hole with side length $0.3$. Homogeneous Dirichlet boundary conditions are imposed on both the outer boundary and the boundary of the hole.
For each parameter value $\boldsymbol{\mu}$, the scalar field $u(\mathbf{x},\boldsymbol{\mu})$ is evaluated on an unstructured finite-element mesh. The supplied dataset was generated with first-order ($\mathbb{P}^1$) finite elements using RBniCS, with an $11\times11$ uniform sampling of the parameter space. Our objective is to learn a reduced-order surrogate that predicts the full solution field from the geometric parameters. In the implementation below, the decoder is built for the fixed mesh size contained in this dataset.
The next cell loads the coordinates, mesh connectivity, solution snapshots, triangulation, and parameter values, and displays one representative snapshot.
# === load the data ===
# x, y -> spatial discretization
# edge_index, triang -> connectivity matrix, triangulation
# u, params -> solution field, parameters
data = torch.load("holed_poisson.pt")
x = data["x"]
y = data["y"]
edge_index = data["edge_index"]
u = data["u"]
triang = data["triang"]
params = data["mu"]
# simple plot
plt.figure(figsize=(4, 4))
plt.tricontourf(x[:, 10], y[:, 10], triang, u[:, 10], 100, cmap="jet")
plt.scatter(params[10, 0], params[10, 1], c="r", marker="x", s=100)
plt.tight_layout()
plt.show()

The dataset contains a solution field $u(\mathbf{x},\boldsymbol{\mu}_i)$ and a corresponding mesh for each parameter realization $\boldsymbol{\mu}_i$. Because the mesh is unstructured, we represent each snapshot as a graph:
- Nodes are the finite-element mesh points.
- Node features are the scalar solution values $u$ at those points.
- Edges encode mesh connectivity.
- Node positions store the physical coordinates $(x,y)$.
- Edge attributes store the absolute coordinate differences between connected nodes.
- Edge weights store the Euclidean distances between connected nodes.
For every parameter realization, we construct a PyTorch Geometric Data object. The resulting list, graphs, contains one graph per solution snapshot.
# number of nodes and number of graphs (parameter realizations)
num_nodes, num_graphs = u.shape
graphs = []
for g in range(num_graphs):
# node positions
pos = torch.stack([x[:, g], y[:, g]], dim=1) # shape [num_nodes, 2]
# edge attributes and weights
ei, ej = pos[edge_index[0]], pos[edge_index[1]] # [num_edges, 2]
edge_attr = torch.abs(ej - ei) # relative offsets
edge_weight = edge_attr.norm(p=2, dim=1, keepdim=True) # Euclidean distance
# node features (solution values)
node_features = u[:, g].unsqueeze(-1) # [num_nodes, 1]
# build PyG graph
graphs.append(
Data(
x=node_features,
edge_index=edge_index,
edge_weight=edge_weight,
edge_attr=edge_attr,
pos=pos,
)
)
Graph-based Reduced-Order Model
Convolutional neural networks are naturally suited to regular grids, but the domains in this dataset are represented by unstructured meshes. A graph representation removes the need for a regular grid: mesh points become nodes, and mesh connectivity becomes the edge structure. This makes a graph neural network (GNN) a suitable choice for processing the solution fields.
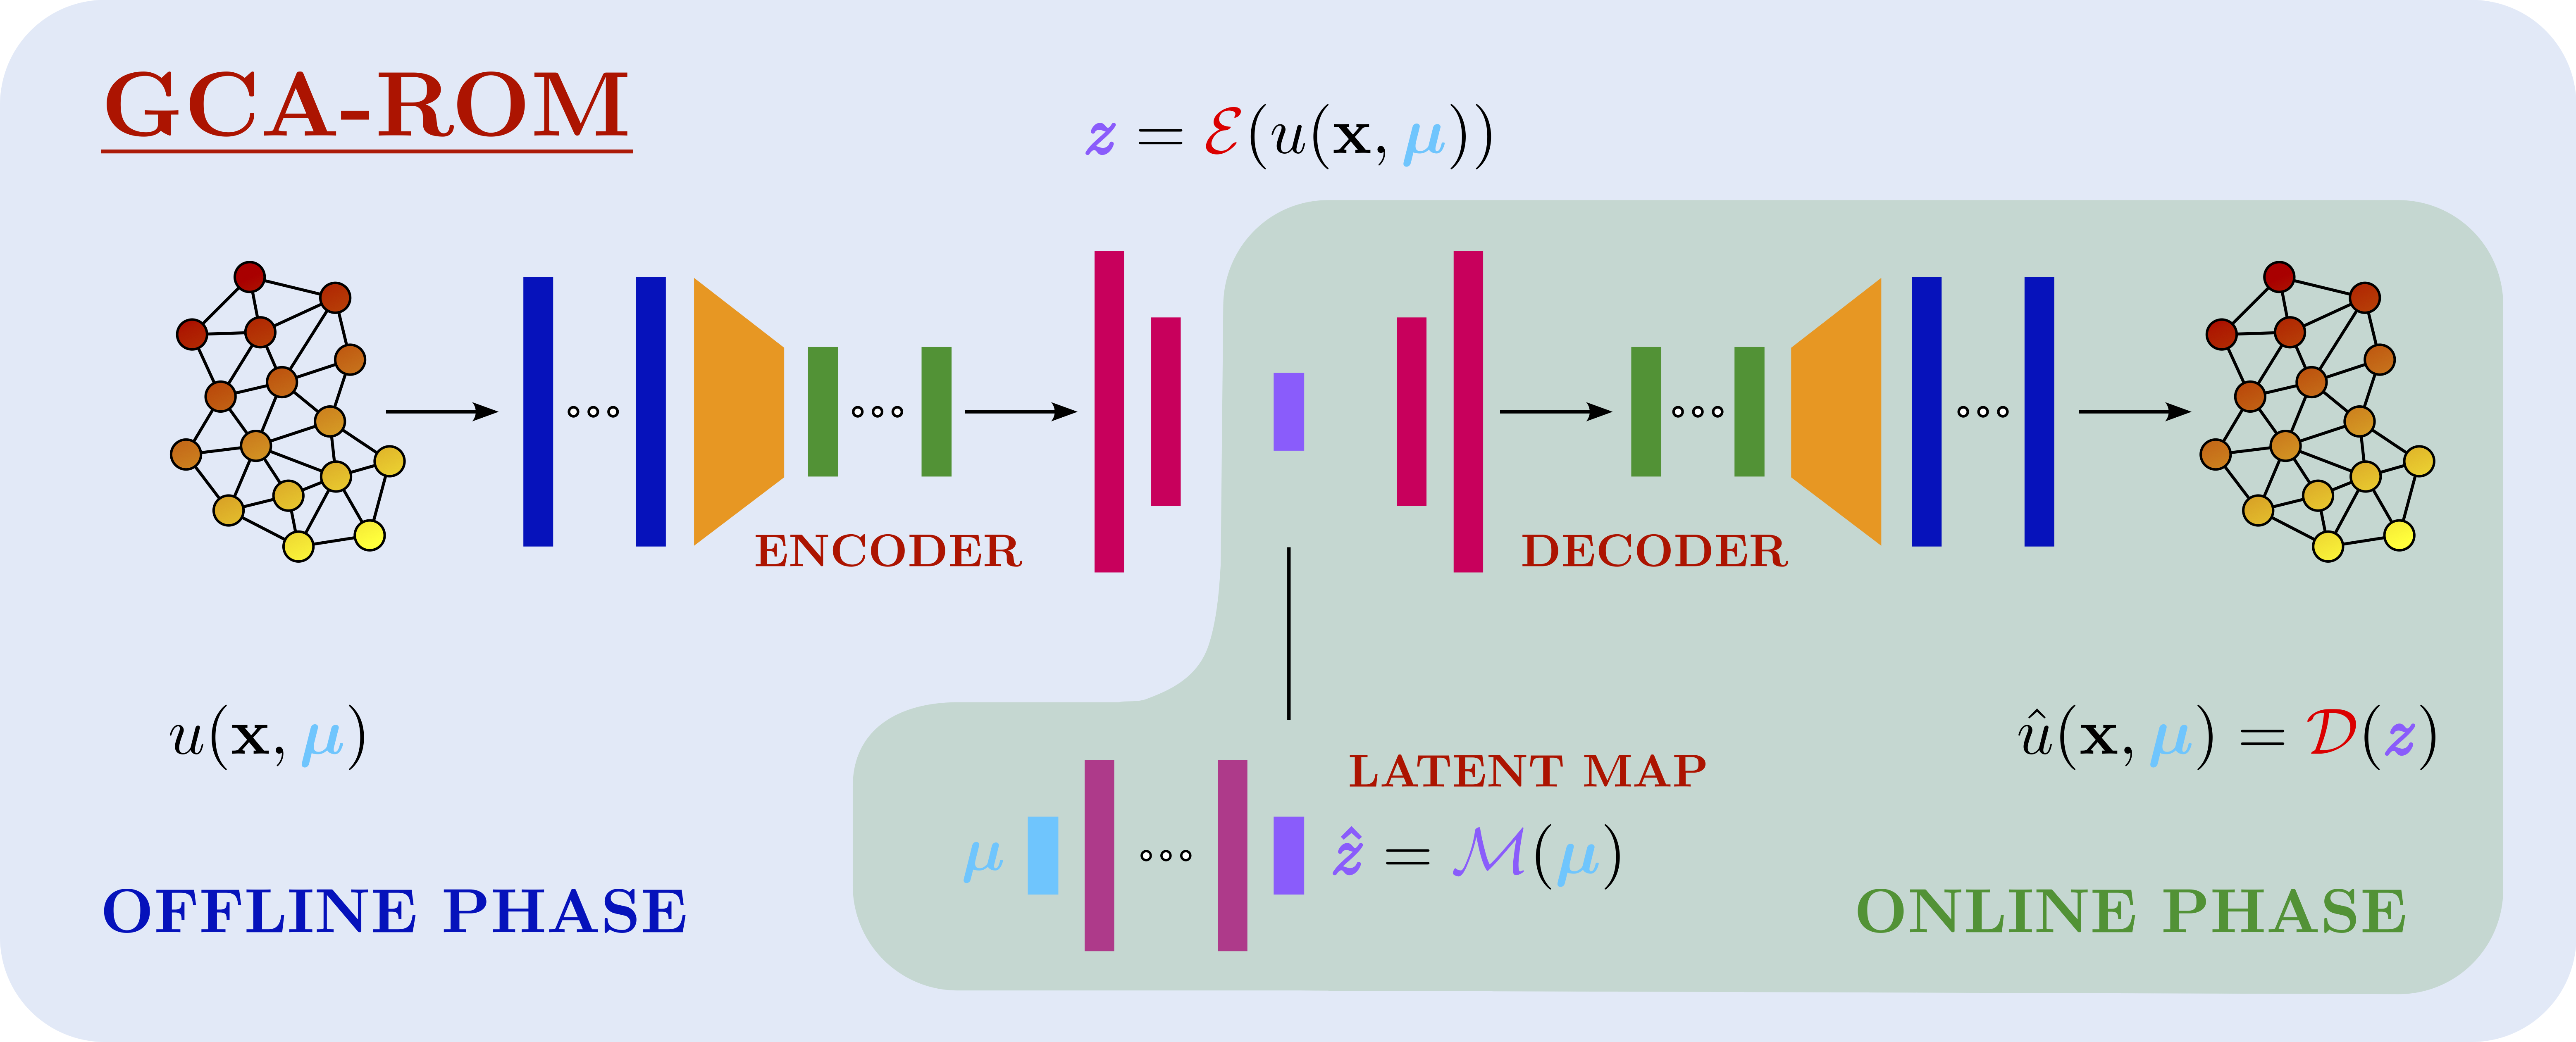
The reduced-order model has three components:
- an encoder $\mathcal{E}$, which compresses a high-dimensional solution snapshot into a low-dimensional latent vector $z$;
- a decoder $\mathcal{D}$, which reconstructs the solution field $\hat{u}$ from that latent vector;
- a parameter-to-latent map $\mathcal{M}$, which predicts the latent vector $\hat{z}$ directly from the physical parameters.
Their roles can be summarized as
$$ z = \mathcal{E}\!\left(u(\mathbf{x},\boldsymbol{\mu})\right), \qquad \widehat{u}(\mathbf{x},\boldsymbol{\mu}) = \mathcal{D}(z), \qquad \widehat{z}=\mathcal{M}(\boldsymbol{\mu}), $$
where $z\in\mathbb{R}^r$ and $r$ is much smaller than the number of mesh degrees of freedom.
Stage 1: train the autoencoder
The encoder and decoder are trained jointly to reconstruct each solution snapshot. For a dataset of $N_s$ snapshots, the reconstruction loss is
$$ \mathcal{L}_{\mathrm{AE}} = \frac{1}{N_s}\sum_{i=1}^{N_s} \left\| u_i- \mathcal{D}\!\left(\mathcal{E}(u_i)\right) \right\|_2^2, $$
with $u_i=u(\mathbf{x},\boldsymbol{\mu}_i)$.
After training, the encoder produces a latent target for each snapshot:
$$ z_i=\mathcal{E}(u_i). $$
Stage 2: learn the parameter-to-latent map
The autoencoder is then kept fixed while $\mathcal{M}$ is trained to reproduce the encoder's latent vectors:
$$ \mathcal{L}_{\mathrm{map}} = \frac{1}{N_s}\sum_{i=1}^{N_s} \left\| z_i-\mathcal{M}(\boldsymbol{\mu}_i) \right\|_2^2. $$
At inference time, no full-order solution is required. For a new parameter value $\boldsymbol{\mu}^*$, the reduced model evaluates
$$ \widehat{u}(\mathbf{x},\boldsymbol{\mu}^*) = \mathcal{D}\!\left(\mathcal{M}(\boldsymbol{\mu}^*)\right). $$
The following cell implements the graph autoencoder as a torch.nn.Module with explicit encode and decode methods. Graph convolutional layers process the mesh data, while fully connected layers compress the graph representation into an eight-dimensional bottleneck and expand it again during decoding.
# Convolutional Autoencoder Model
class GraphConvolutionalAutoencoder(torch.nn.Module):
def __init__(
self, hidden_channels, bottleneck, input_size, ffn, act=torch.nn.ELU
):
super().__init__()
self.hidden_channels, self.input_size = hidden_channels, input_size
self.act = act()
self.current_graph = None
# Encoder graph layers
self.fc_enc1 = torch.nn.Linear(input_size * hidden_channels[-1], ffn)
self.fc_enc2 = torch.nn.Linear(ffn, bottleneck)
self.encoder_convs = torch.nn.ModuleList(
[
GMMConv(
hidden_channels[i],
hidden_channels[i + 1],
dim=1,
kernel_size=5,
)
for i in range(len(hidden_channels) - 1)
]
)
# Decoder graph layers
self.fc_dec1 = torch.nn.Linear(bottleneck, ffn)
self.fc_dec2 = torch.nn.Linear(ffn, input_size * hidden_channels[-1])
self.decoder_convs = torch.nn.ModuleList(
[
GMMConv(
hidden_channels[-i - 1],
hidden_channels[-i - 2],
dim=1,
kernel_size=5,
)
for i in range(len(hidden_channels) - 1)
]
)
def encode(self, data):
self.current_graph = data
x = data.x
for conv in self.encoder_convs:
x = self.act(conv(x, data.edge_index, data.edge_weight) + x)
x = x.reshape(-1, self.input_size * self.hidden_channels[-1])
return self.fc_enc2(self.act(self.fc_enc1(x)))
def decode(self, z, decoding_graph=None):
data = decoding_graph or self.current_graph
x = self.act(self.fc_dec2(self.act(self.fc_dec1(z)))).reshape(
-1, self.hidden_channels[-1]
)
for i, conv in enumerate(self.decoder_convs):
x = conv(x, data.edge_index, data.edge_weight) + x
if i != len(self.decoder_convs) - 1:
x = self.act(x)
return x
def forward(self, data):
z = self.encode(data)
return self.decode(z, decoding_graph=data)
Train the Graph Autoencoder
We now train the autoencoder with PINA's supervised-learning workflow.
First, we define a SupervisedProblem:
- input: graph objects containing the solution fields and mesh information;
- target: the original node-wise solution values that the autoencoder must reconstruct.
In other words, the model receives each graph and is trained to reproduce its node features.
autoencoder_target = torch.stack([g.x for g in graphs], dim=0)
autoencoder_problem = SupervisedProblem(graphs, autoencoder_target)
Next, instantiate the graph autoencoder. The bottleneck dimension is set to $8$, so each solution snapshot is compressed from 1,352 nodal values to an eight-dimensional latent vector.
autoencoder = GraphConvolutionalAutoencoder(
hidden_channels=[1, 1],
bottleneck=8,
input_size=1352,
ffn=200,
act=torch.nn.ELU,
)
We then create a custom mean-squared-error loss that accepts either standard tensors or PyTorch Geometric Data objects. Finally, we pass the problem, model, loss, optimizer, and learning rate to SupervisedSingleModelSolver.
# This loss handles both Data and Torch.Tensors
class CustomMSELoss(torch.nn.MSELoss):
def forward(self, output, target):
if isinstance(target, Data):
target = target.x
return torch.nn.functional.mse_loss(
output, target, reduction=self.reduction
)
# Define the solver
autoencoder_solver = SupervisedSingleModelSolver(
problem=autoencoder_problem,
model=autoencoder,
use_lt=False,
loss=CustomMSELoss(),
optimizer=TorchOptimizer(torch.optim.Adam, lr=0.001, weight_decay=1e-05),
)
The Trainer manages the training loop and the train-validation split. To keep the runtime suitable for a tutorial, we train for 300 epochs using 30% of the snapshots for training and 70% for validation. These settings are intended to demonstrate the workflow rather than maximize predictive accuracy.
autoencoder_trainer = Trainer(
solver=autoencoder_solver,
accelerator="cpu",
max_epochs=300,
train_size=0.3,
val_size=0.7,
test_size=0.0,
shuffle=True,
)
autoencoder_trainer.train()
GPU available: False, used: False
TPU available: False, using: 0 TPU cores
💡 Tip: For seamless cloud logging and experiment tracking, try installing [litlogger](https://pypi.org/project/litlogger/) to enable LitLogger, which logs metrics and artifacts automatically to the Lightning Experiments platform.
💡 Tip: For seamless cloud uploads and versioning, try installing [litmodels](https://pypi.org/project/litmodels/) to enable LitModelCheckpoint, which syncs automatically with the Lightning model registry.
| Name | Type | Params | Mode | FLOPs --------------------------------------------------------------- 0 | _pina_models | ModuleList | 545 K | train | 0 1 | _loss_fn | CustomMSELoss | 0 | train | 0 --------------------------------------------------------------- 545 K Trainable params 0 Non-trainable params 545 K Total params 2.183 Total estimated model params size (MB) 16 Modules in train mode 0 Modules in eval mode 0 Total Flops
`Trainer.fit` stopped: `max_epochs=300` reached.
Train the Parameter-to-Latent Network
After training the autoencoder, we encode every solution snapshot to obtain its latent representation. These latent vectors become the targets for the second model. This step is the key transition from compression to reduced-order prediction: instead of requiring a full solution field as input, the new network will learn to predict the corresponding latent vector directly from $\boldsymbol{\mu}$.
The call to .detach() removes the latent targets from the autoencoder's computational graph, so the autoencoder parameters are not updated during the next training stage.
latent_representations = (
torch.stack([autoencoder.encode(g) for g in graphs], dim=0)
.squeeze()
.detach()
)
As before, we formulate the task as a SupervisedProblem:
- input: the two-dimensional parameter vectors $\boldsymbol{\mu}_i$;
- target: the corresponding eight-dimensional latent vectors $z_i$ produced by the trained encoder.
interpolation_problem = SupervisedProblem(params, latent_representations)
For the parameter-to-latent map, we use a small fully connected FeedForward network. It takes the two geometric parameters as input and returns an eight-dimensional vector matching the autoencoder bottleneck.
# Interpolation network
interpolation_network = FeedForward(
input_dimensions=2,
output_dimensions=8,
n_layers=2,
inner_size=200,
func=torch.nn.Tanh,
)
Then, we pass the problem, model, loss, optimizer, and learning rate to SupervisedSingleModelSolver.
interpolation_solver = SupervisedSingleModelSolver(
problem=interpolation_problem,
model=interpolation_network,
use_lt=False,
loss=CustomMSELoss(),
optimizer=TorchOptimizer(torch.optim.Adam, lr=0.001, weight_decay=1e-05),
)
We train the interpolation network with the same optimizer and data split used for the autoencoder. Once training is complete, the two models can be combined into the full graph convolutional autoencoder reduced-order model.
interpolation_trainer = Trainer(
solver=interpolation_solver,
accelerator="cpu",
max_epochs=300,
train_size=0.3,
val_size=0.7,
test_size=0.0,
shuffle=True,
)
interpolation_trainer.train()
GPU available: False, used: False
TPU available: False, using: 0 TPU cores
💡 Tip: For seamless cloud logging and experiment tracking, try installing [litlogger](https://pypi.org/project/litlogger/) to enable LitLogger, which logs metrics and artifacts automatically to the Lightning Experiments platform.
💡 Tip: For seamless cloud uploads and versioning, try installing [litmodels](https://pypi.org/project/litmodels/) to enable LitModelCheckpoint, which syncs automatically with the Lightning model registry.
| Name | Type | Params | Mode | FLOPs --------------------------------------------------------------- 0 | _pina_models | ModuleList | 42.4 K | train | 0 1 | _loss_fn | CustomMSELoss | 0 | train | 0 --------------------------------------------------------------- 42.4 K Trainable params 0 Non-trainable params 42.4 K Total params 0.170 Total estimated model params size (MB) 9 Modules in train mode 0 Modules in eval mode 0 Total Flops
`Trainer.fit` stopped: `max_epochs=300` reached.
Evaluate the complete GCA-ROM
The complete prediction pipeline has two operations:
- Map to the latent space: evaluate the trained
interpolation_networkat a parameter value $\boldsymbol{\mu}$. - Decode the latent vector: pass the predicted latent representation to the autoencoder decoder to reconstruct the nodal solution field.
The next cell performs this procedure for all parameter samples. The graphs are batched so that the decoder can process them together, and the output is then converted back to a dense tensor for comparison with the reference solutions.
# interpolate
z = interpolation_solver(params)
# decode
batch = Batch.from_data_list(graphs)
out = autoencoder.decode(z, decoding_graph=batch)
out, _ = to_dense_batch(out, batch.batch)
out = out.squeeze(-1).T.detach()
Finally, we compute the mean relative $L^2$ error across the dataset and inspect one representative prediction.
The three panels compare:
- the GCA-ROM prediction;
- the finite-element reference solution;
- the pointwise squared error.
The predicted and reference fields use the same color scale, making their amplitudes directly comparable.
# compute error
l2_error = (torch.norm(out - u, dim=0) / torch.norm(u, dim=0)).mean()
print(f"L2 relative error {l2_error:.2%}")
# plot solution
idx_to_plot = 100
# Determine min and max values for color scaling
vmin = min(out[:, idx_to_plot].min(), u[:, idx_to_plot].min())
vmax = max(out[:, idx_to_plot].max(), u[:, idx_to_plot].max())
plt.figure(figsize=(16, 4))
plt.subplot(1, 3, 1)
plt.tricontourf(
x[:, idx_to_plot],
y[:, idx_to_plot],
triang,
out[:, idx_to_plot],
100,
cmap="jet",
vmin=vmin,
vmax=vmax,
)
plt.title("GCA-ROM")
plt.colorbar()
plt.subplot(1, 3, 2)
plt.title("True")
plt.tricontourf(
x[:, idx_to_plot],
y[:, idx_to_plot],
triang,
u[:, idx_to_plot],
100,
cmap="jet",
vmin=vmin,
vmax=vmax,
)
plt.colorbar()
plt.subplot(1, 3, 3)
plt.title("Square Error")
plt.tricontourf(
x[:, idx_to_plot],
y[:, idx_to_plot],
triang,
(u - out).pow(2)[:, idx_to_plot],
100,
cmap="jet",
)
plt.colorbar()
plt.ticklabel_format()
plt.show()
L2 relative error 6.89%

The model has now completed the full reduced-order workflow: graph-based compression, latent-space interpolation, and solution reconstruction.
With only 300 training epochs and 30% of the data used for fitting, the result is primarily a demonstration of the method. The reconstructed field may appear less smooth than the finite-element solution. Longer training, a larger training split, and systematic hyperparameter tuning can substantially improve the reconstruction.
What's Next?
Congratulations on completing the introductory tutorial on Graph Convolutional Reduced Order Modeling! Now that you have a solid foundation, here are a few directions to explore:
Experiment with Training Duration — Try different training durations and adjust the network architecture to optimize performance. Explore different integral kernels and observe how the results vary.
Explore Physical Constraints — Incorporate physics-informed terms or constraints during training to improve model generalization and ensure physically consistent predictions.
...and many more! — The possibilities are vast! Continue experimenting with advanced configurations, solvers, and features in PINA.
For more resources and tutorials, check out the PINA Documentation.